


Monthly Fiscal Impulse Review - May 2025
Fiscal Flows Reignite as Spending Accelerates into Month-End

Good morning folks,
It’s time for the weekly and monthly review of fiscal flows for May 2025 and week 35 of the fiscal year.
Weekly Review

For week 35 of fiscal year 2024, the average net flow was $31.9bn, which is $6.1bn higher than the same period last year. This brings the 4-week average to -$460 million. On a 3-year basis, we were $13.27bn above average. Based on historical patterns, we were expecting $27.5bn, so this week’s figure represents a real boost—mostly driven by a significant $91bn disbursement on Friday.

On a GDP-adjusted basis, we reached 0.85% of GDP, which is 14bps above the same week last year. This surge in spending marks a renewed acceleration and brings us closer to the fiscal impulse levels of 2022. The data points to a bullish impulse for both risk assets and the broader economy.
Looking at unemployment benefits, the picture remains mixed. We continue to believe that current macro uncertainty will weigh on the job market, as future output remains unclear. For week 35, the average flow was $167.5 million, $17 million higher than last year. This brings the 1-month average to a $15 million surplus. On a 3-year average, we’re $44 million above, with a 1-month average at $31.5 million. Overall, these figures suggest some early signs of weakness.

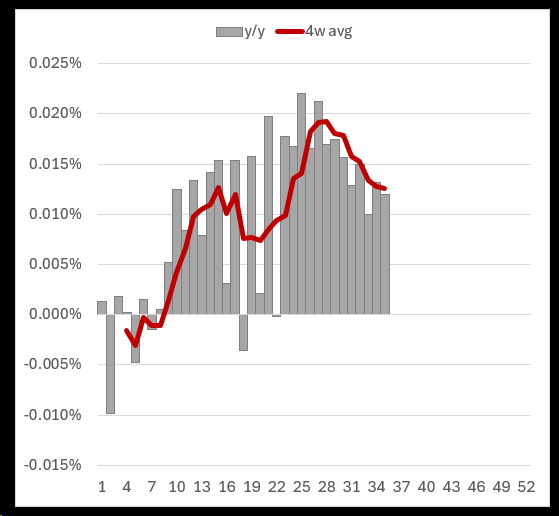
However, when examining tax flows, there is no clear evidence yet of a labor market breakdown. Total tax collection stood at $14.03bn, up 4.72% year-over-year, with a 4-week average growth of 13.89% and a 3-month average of 10.75%. Adjusted for GDP, we are at 2.49%, which is 22bps above last year and 5bps above the 5-year average. While the y/y figures remain strong, the pace of acceleration is slowing, possibly indicating a "peak" in momentum. Still, these are solid numbers that reflect a healthy economy.

Zooming in on income taxes, we observe a slowdown in growth, as shown in the chart below. That said, recent weeks have shown stabilization, and the weakness seen in benefits is not yet confirmed by tax data.
Keep reading with a 7-day free trial
Subscribe to spaghettilisbon's Market Digest to keep reading this post and get 7 days of free access to the full post archives.