


Monthly Fiscal Impulse Review - June 2025

We’ll cover the weekly data quickly, focusing only on key insights.
Fiscal impulse
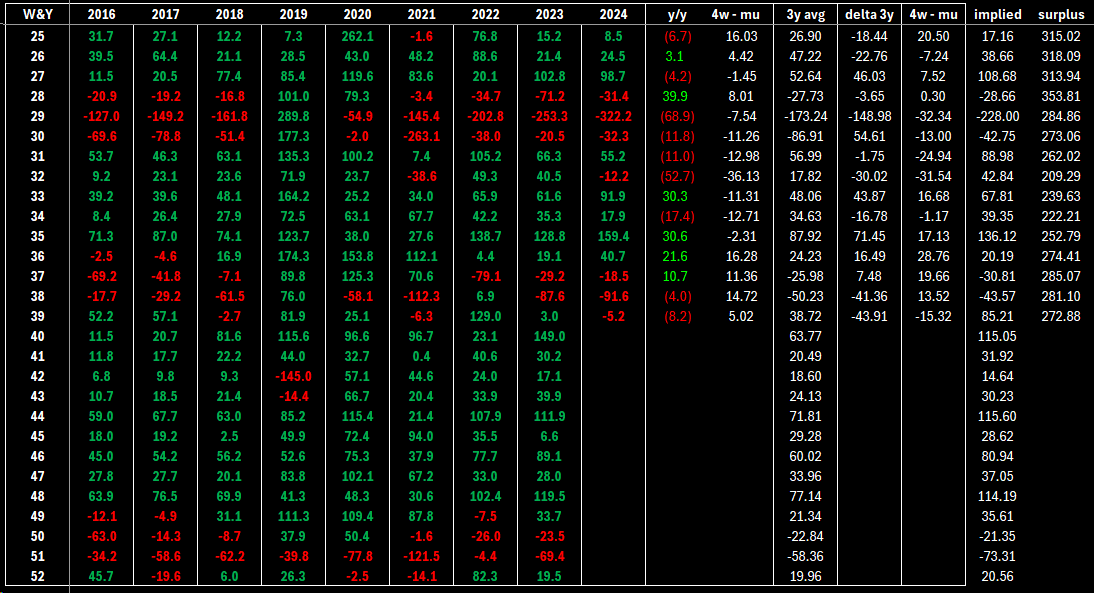
For week 39 of the fiscal year, the flow was marginally negative at -5.2 billion. This was 8.2 billion higher than the same period last year, when we saw a net addition of 3 billion USD. On a nominal basis, we remain well above last year’s cumulative impulse but slightly below the 2022 fiscal year value. Flows have been decelerating nominally in recent weeks, but the overall impulse remains quite supportive.
On a GDP-adjusted basis, we stand at 4.01 percent of GDP

* 77 basis points above the same period last year
* 22 basis points above the 3-year average
* 61 basis points above the historical average
These flows continue to support and stabilize economic activity.
Unemployment benefits
Total handouts stood at 706 million, 50 million above the same period last year, marking a 7.62 percent increase. The one-month average is now at 1.41 percent year-over-year growth.

Visually, the second half of June showed some relief in benefit outflows. We do not observe significant stress in these numbers—benefits have likely peaked.

Tax flows
Total tax collections for week 39 amounted to 93.9 billion, 19 percent above the same period last year. On a nominal basis, flows remain solid.

The 4-week average stands at 5.30 percent, and the 3-month average at 9.95 percent. Visually, we can see that the growth trend is no longer accelerating, but rather entering a steady phase.
Let’s now turn to monthly values and provide a guide for the month of July.
Keep reading with a 7-day free trial
Subscribe to spaghettilisbon's Market Digest to keep reading this post and get 7 days of free access to the full post archives.